A printable version of this application note is available here: A7 – EIS Quality Indicators and Linearity Correction
Introduction
Electrochemical Impedance Spectroscopy (EIS) is a powerful analytical technique used to identify and quantify impedance components within electrochemical systems. Although widely adopted across various fields of electrochemistry, EIS remains a complex method that demands a thorough understanding of the system under investigation [1,2,3].
In a typical EIS experiment, a sinusoidal voltage is applied to the system, and the resulting current is measured. Using Fourier transformation, the real and imaginary impedances and phase shift are determined. These data are then fitted to an equivalent circuit model to extract values for individual components. By sweeping across a broad frequency range, key electrochemical properties such as charge transfer resistance and double-layer capacitance can be characterized. To capture all relevant processes, each with distinct time constants, the frequency range must be carefully optimized. A common starting range is from 100 kHz to 1 Hz, which can be adjusted based on initial results. To maintain (pseudo)linearity in the system’s response, the amplitude of the voltage perturbation is kept low, usually around 10 mV. However, this value may be fine-tuned to balance signal-to-noise ratio and linearity, ensuring reliable measurements [1].
The validity of EIS data is assessed by checking for linearity, stability, and causality. Causality is typically verified using the Kramers-Kronig relations [4], while linearity can be evaluated through metrics such as Total Harmonic Distortion and Total Linearity Error.
In low-impedance devices like batteries or electrolysers, achieving a sufficient signal-to-noise ratio often requires higher perturbation amplitudes, which can introduce non-linearities and harmonic distortion. Recent advancements have enabled compensation for these harmonics, allowing reconstruction of the signal as if a low-amplitude perturbation had been used [5].
Theory
As previously mentioned, impedance in EIS is determined by applying a Fourier transformation to the measured voltage and current signals. More specifically, this transformation isolates the signal components at the fundamental frequency. If the applied voltage amplitude is too high, it can induce non-linear behaviour in the system, resulting in harmonic distortions in the current response. These harmonics distort the calculated impedance, leading to inaccurate results.
To evaluate the extent of these distortions, the Total Harmonic Distortion (THD) is commonly used. It quantifies the magnitude of the harmonics relative to the fundamental frequency. In an ideal scenario, harmonic content would be zero. However, due to the inherently non-linear nature of electrochemical systems, some level of harmonic generation is unavoidable. It is the responsibility of the skilled electrochemist to minimize these harmonics while still maintaining a sufficiently high signal-to-noise ratio. This balance is crucial for obtaining reliable and meaningful impedance data.
The Total Harmonic Distortion (THD) is calculated by
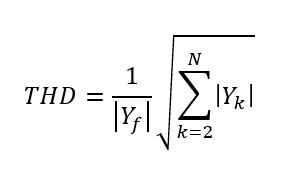
, where is the magnitude of the fundamental frequency, is the magnitude of the th harmonic and is the number of total harmonics.
Another useful metric for evaluating the linearity of an EIS measurement is the Total Linearity Error (TLE). It is defined by the following equation
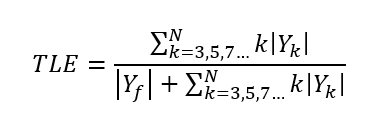
, where:
Both THD and TLE are expressed as a percentage and provide insights into the degree of non-linearity present in the system. For a more detailed discussion on TLE, readers are referred to reference [5].
Example
Measurements were conducted on a custom-built circuit designed to replicate the non-linear behaviour typical of electrochemical systems. This circuit, along with its current response to a linear voltage sweep (LVS), is shown in Figure 1. The pronounced non-linearity in the current response makes it an ideal model for demonstrating how the potential amplitude influences the current response and consequently the THD and TLE.
Potentiostatic Electrochemical Impedance Spectroscopy (PEIS) measurements were carried out using voltage amplitudes of 10 mV and 100 mV. To highlight the impact of non-linear current behaviour at these amplitudes, the DC bias was set to 0.1 V. The frequency range spanned from 100 kHz down to 1 mHz, with five logarithmically spaced points per decade.
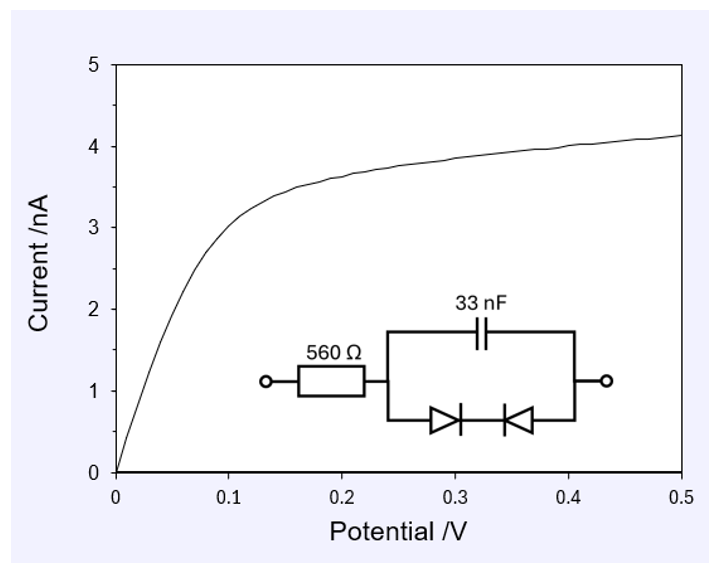
Figure 1: Electronic circuit and its current response to a linear voltage sweep.
The influence of amplitude on the current response is illustrated in Figure 2. At a PEIS amplitude of 10 mV, the current response closely resembles a pure sine wave, indicating minimal distortion. In contrast, when the amplitude is increased to 100 mV, the current response becomes significantly distorted, deviating from the ideal sinusoidal shape. This highlights the impact of non-linear behaviour at higher perturbation amplitudes. The next step is to evaluate the THD and TLE data.
In the SigView window, showing the scope like graphs of Figure 2, the THD and TLE values can be found at discrete frequencies. To view the THD and TLE values for all measured frequencies, as depicted in Figure 3, the user can open Equivalent circuit analysis and select the corresponding tab. The two graphs in Figure 3 illustrate that the applied voltage amplitude significantly influences both metrics. At high frequencies, the difference between 10 mV and 100 mV is minimal, since the current response is predominantly Ohmic. However, at low frequencies, the non-linear behaviour becomes more pronounced: THD and TLE values increase sharply for the 100 mV amplitude, while remaining low for the 10 mV case.
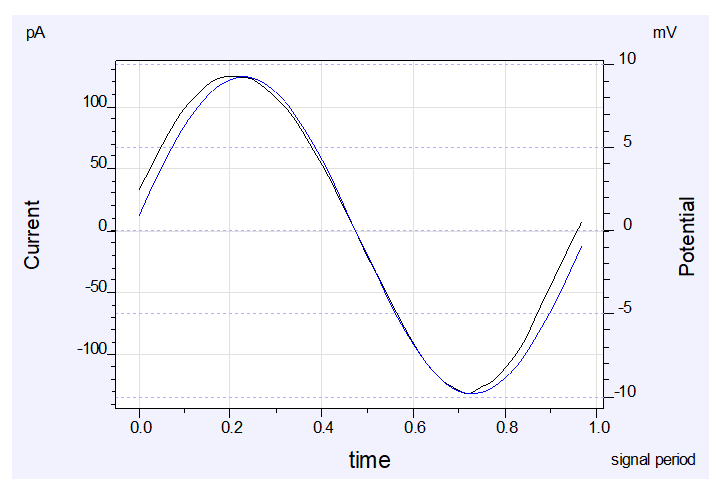
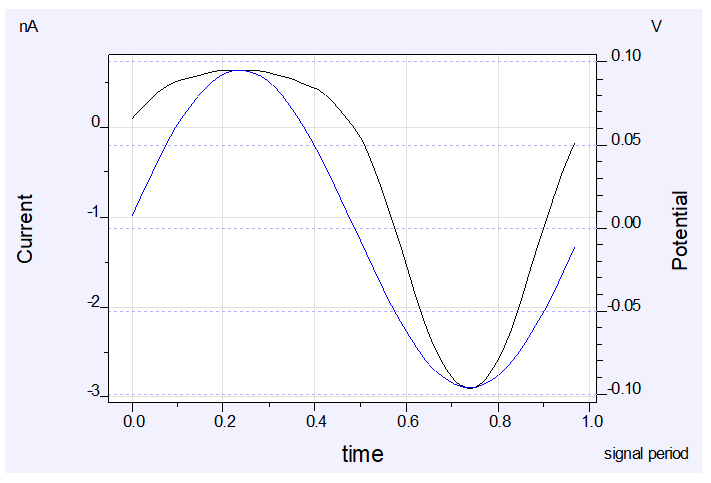
Figure 2: Measured current response (black line) at a voltage amplitude of 10 mV (top, blue line) and 100 mV (bottom, blue line) with a frequency of 0.1 Hz.
Although there is no strict threshold for acceptable THD values, it is generally agreed that both THD and TLE should remain below 5% to ensure reliable data. Based on this guideline, the measurement at 100 mV amplitude exceeds acceptable limits and the measurement should be repeated using a smaller amplitude to avoid distortion and ensure data reliability.
Certain devices under test (DUTs), such as electrolysers and batteries, typically exhibit low Ohmic resistance and therefore require relatively large voltage or current amplitudes to achieve a sufficient signal. However, this often compromises the linearity condition essential for accurate EIS measurements.
As a solution, IviumSoft provides a feature to compensate for harmonic distortions caused by excessive EIS amplitudes. This Linearity Correction option is available in the Analysis à Equivalent Circuit window under Options. Figure 4 demonstrates the effect of enabling this correction on EIS data collected with a 100 mV amplitude which, as previously discussed, exhibits significant non-linearity. The correction helps to recover an accurate representation of the system’s impedance response, even under challenging measurement conditions.
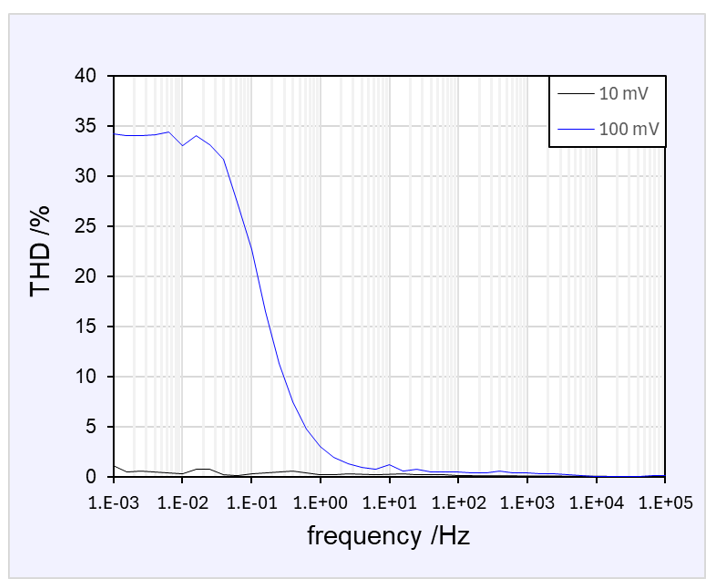
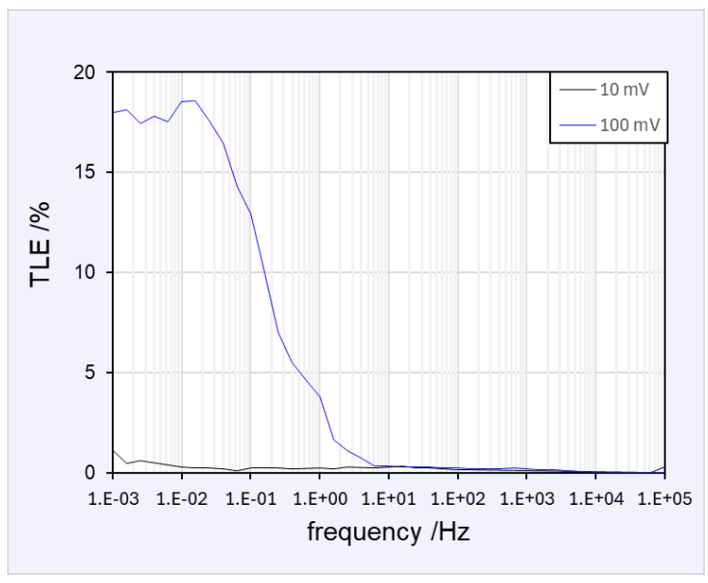
Figure 3: THD (top) and TLE (bottom) of the EIS data.
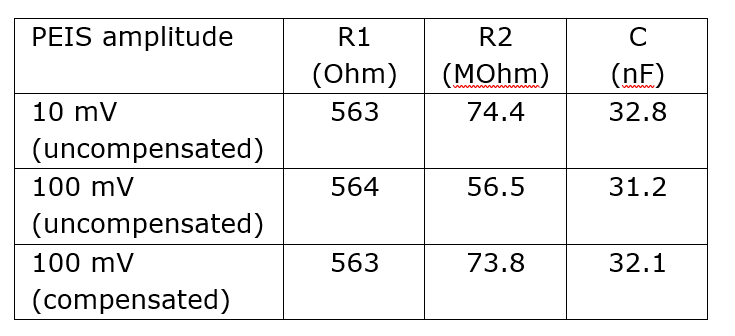
The Nyquist plot of the uncompensated data initially appears to exhibit typical Randles circuit characteristics, giving the impression that the measurement is valid. However, once the Linearity Correction is applied in IviumSoft, a significantly different response, shown as the blue curve in Figure 4, is obtained. This corrected curve reveals substantial deviations from the original, highlighting the impact of non-linear distortions at higher amplitudes. The corresponding values for the equivalent circuit components, based on the Randles model, are summarized in Table 1, and show a significant effect on R2.
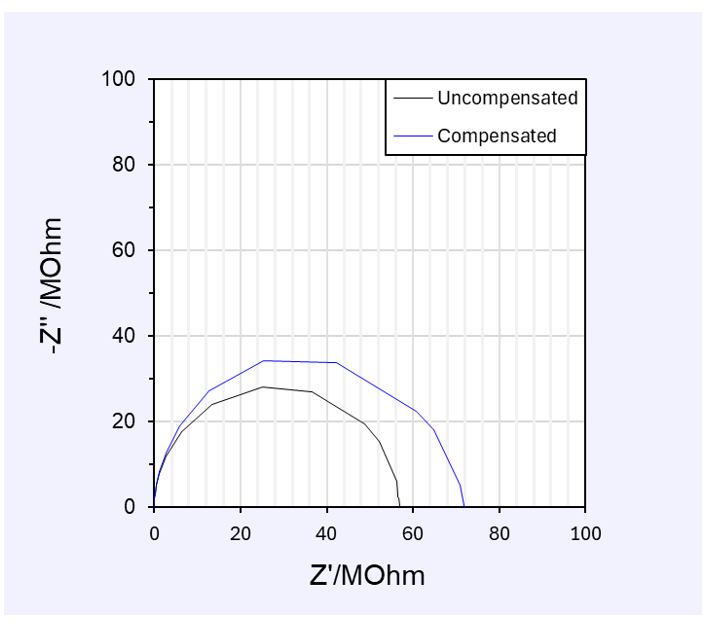
Figure 4: Nyquist plot of the EIS measured at 100 mV without (black) and with (blue) linearity correction.
Table 1: Equivalent circuit fit results.
Conclusions
In this application note, we introduced Total Harmonic Distortion (THD) and Total Linearity Error (TLE) as quantitative indicators of the quality of electrochemical impedance spectroscopy (EIS) measurements. These metrics can be used to optimize the excitation amplitude and ensure reliable data acquisition.
For DUTs that require higher perturbation amplitudes, often resulting in harmonic distortion, IviumSoft offers a Linearity Correction feature. This tool enables compensation for non-linear effects, helping to restore measurement accuracy even under challenging conditions.
References
[1] Bard, A.J. and Faulkner, L.R. (2000) Electrochemical Methods: Fundamentals and Applications. 2nd Edition, Wiley, New York. https://doi.org/10.1023/A:1021637209564
[2] Lasia, A. (2002). Electrochemical Impedance Spectroscopy and its Applications. In: Conway, B.E., Bockris, J.O., White, R.E. (eds) Modern Aspects of Electrochemistry. Modern Aspects of Electrochemistry, vol 32. Springer, Boston, MA. https://doi.org/10.1007/0-306-46916-2_2
[3] Impedance Spectroscopy: Theory, Experiment, and Applications, Editor(s):
Dr. Evgenij Barsoukov, Dr. J. Ross Macdonald, First published:25 March 2018
https://doi.org/10.1002/9781119381860
[4] Boukamp, B.A. (1995) A Linear Kronig-Kramers Transform Test for Immittance Data Validation, J. Electrochem. Soc. 142 (6) 1885.