A printable version of this electrochemical note is available here: IEN6 – Equivalent circuit EIS fitting with non-linear elements
A novel tool for EIS data analysis was developed for the study of non-linear Electrochemical systems. Higher amplitudes may be applied without causing measurement artefacts, resulting in impedance results with a better signal/noise ratio. Also, extra information is obtained from the 2nd and 3rd order impedance derivatives. For Butler-Volmer type reactions, these can be used to determine Tafel slopes and rate constants. For semiconductors and batteries, higher orders offer great potential due to their higher sensitivity (for background see full text article).
With IviFit – included with the Ivium Technologies software package – the equivalent circuit can be defined as usual by dropping visual components on a network grid, see Figure 1. The innovation is the introduction of an additional component: H. This component corresponds with a set of derivatives that can apply to any Potential/Current relation. In this manner, the tool is compatible with any electrochemical process.
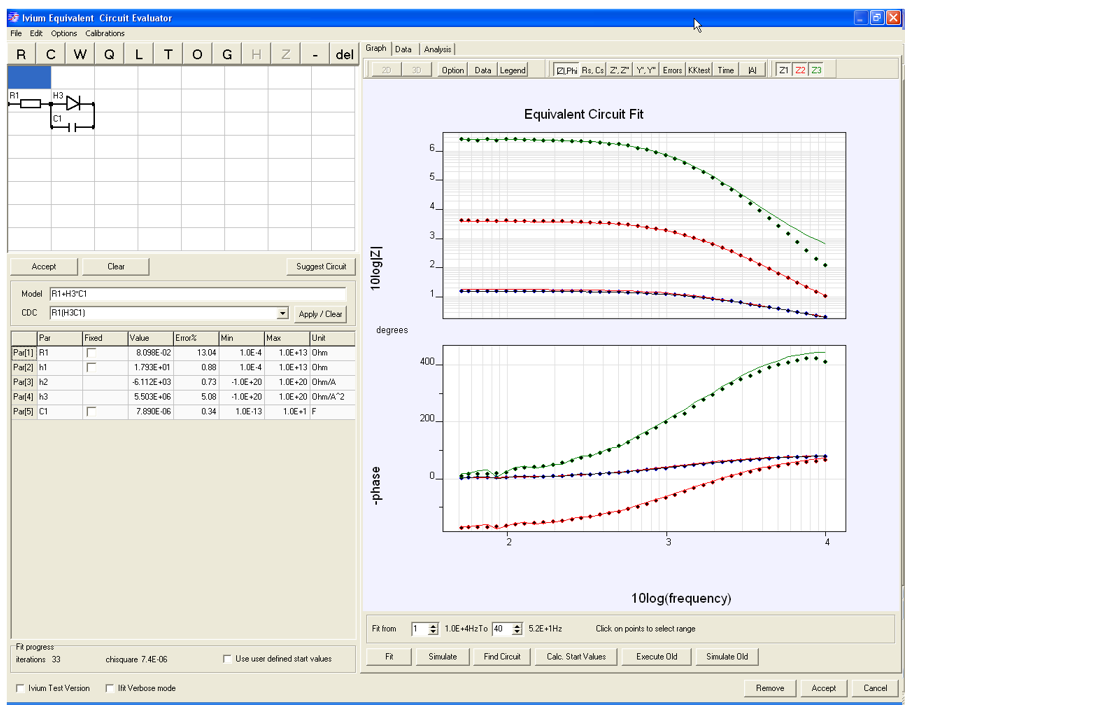
Figure 1: Equivalent Circuit Fitting with a non-linear component (semiconductor). Blue=1st order; red=2nd order; green=3rd order. The symbols are experimental points, whereas the lines are calculated from the fitted model.
The fitting can be done as usual. The 3rd order analysis will yield 3 sets of complex plots. The tool delivers the fit-able parameters h1, h2, and h3. These correspond to the differentials hn = (dnE/dJn). One can derive these differentials from its current/potential equation, and so give practical meaning to the fitted result. Examples for Butler-Volmer and semiconductors have already been worked out. Even when the I/E equation is not known (yet), one can use the result as a sensitive fingerprint.
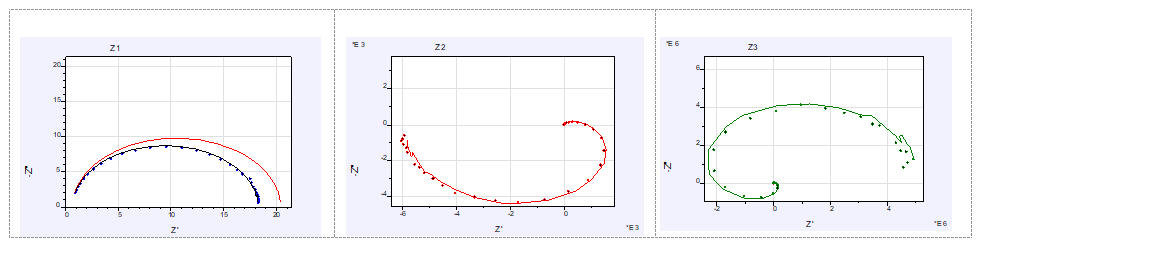
Figure 2: Nyquist plots for 3 orders, corresponding to lines and symbols in Figure 1. The extra red line in the Z1 plot is the theoretical 1st order impedance (zero-amplitude).
The tool uses the experimental results from the first 3 harmonics as input, and models those on the differential equations with 3 orders. That yields 3 Nyquist plots, Z1..Z3 see Figure 2. It is important to realize that the 3 sets of experimental and modelled data are in fact one single modelled result. The separate order sets could not be independently modelled correctly due to the internal relations and between orders/harmonics. The zero-amplitude line in Figure 2, Z1 is evidence for this.
The potential advantage of moving to the higher order techniques is the promise of better sensitivity. It is now well known that the 1st order impedance result is more sensitive than the 0th order DC technique. Every next higher order derivative is more pronounced and shows more detail. Therefore, this novel approach could become a powerful addition to the R&D arsenal of tools.