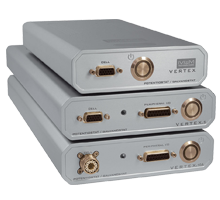
A printable version of this application note is available here: A6-3 – Simultaneous multi-point EIS using the peripheral port
Introduction
A typical potentiostat measures EIS at the working electrode (WE). In 2-electrode measurement configuration, where WE+S and CE+RE are paired, the EIS result will be the total cell impedance. However, when measuring in the 3-electrode configuration, when a discrete reference point or electrode is used, the connections are WE+S, RE and CE. In this case the EIS will be measured between WE+S and RE, resulting in the impedance of the ‘half-cell’.
There are various applications where it can be useful to measure EIS at multiple points in your cell, simultaneously. For example, if you wish to measure not only the impedance between WE+S and RE (the ‘half-cell’), but also the impedance of the total cell (between WE and CE). Or even at multiple points in a cell or cell-stack.
For these applications Ivium offers the solution to use the peripheral port (analog input(s)) to measure additional impedances.
Ivium peripheral port
Most Ivium potentiostats are equipped with a peripheral port, i.e. a connector that gives access to analog inputs, which can be used to measure additional impedances. An additional module may be required for this application. Some Ivium potentiostats without a peripheral port may have analog input 1 available on the cell connector through the WE2 pin. Your instrument specifications (see IviumSoft helpfile for specifications) will list if this option to connect to the analog input 1 is available.
Activating peripheral EIS
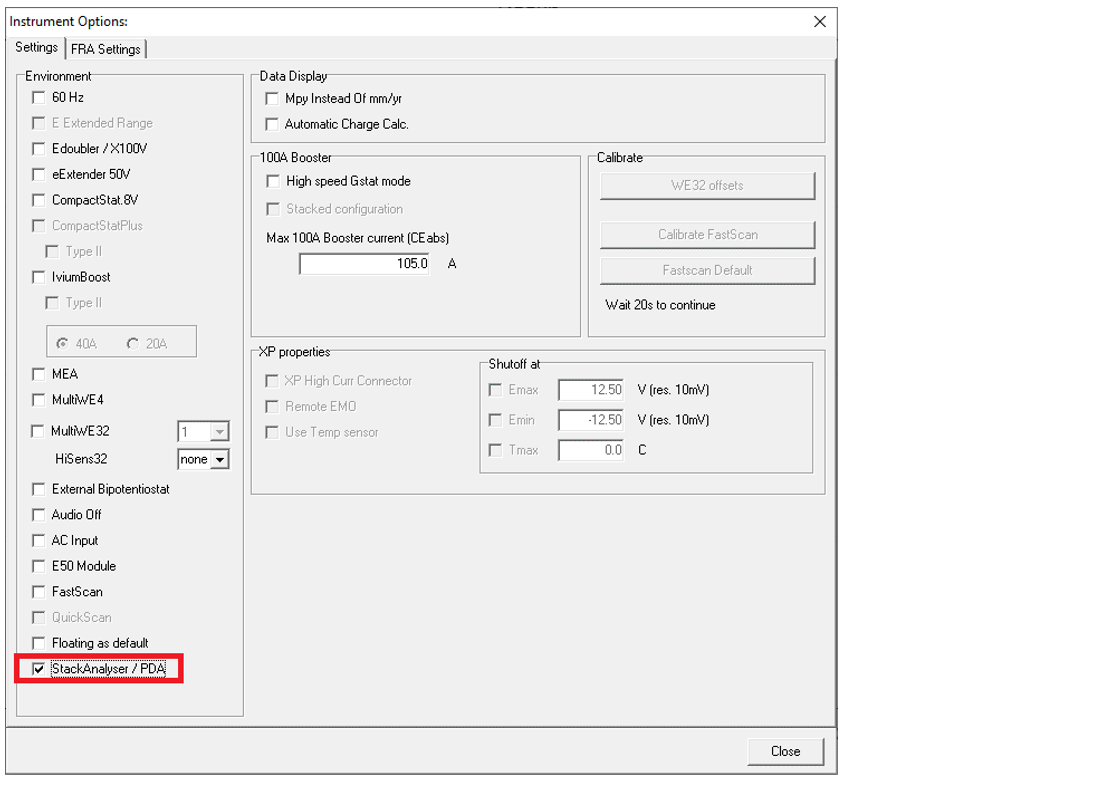
To allow correct measurement of EIS on the peripheral port, first check the option Stackanalyser/PDA in the options>options window accessed from the top menu bar of IviumSoft (see below). Here, PDA refers to any of PDA2, sPDA, PDA-T, Cell-PDA, OctoPDA, and OctoPDA-T.
Cell-PDA
The Cell-PDA module connects between your Ivium potentiostat and the cell cable and gives access to the analog input 1.
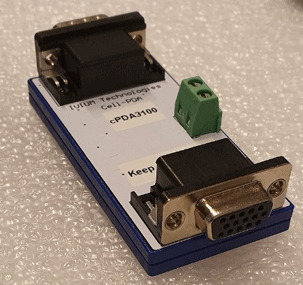
The cell-PDA module creates 1 high impedance differential analog input signal. A terminal block allows connection of your leads of choice.
Using the Cell-PDA for a multi-point simultaneous EIS measurement will result in 2 impedance signals:
– 1 EIS signal from the cell cable
– 1 EIS signal from the Cell-PDA
Example 1: resistor measurement
Setup
In this example a PocketSTAT2 potentiostat + Cell-PDA is connected to 2 x Testcell1 in series (each 1kOhm).
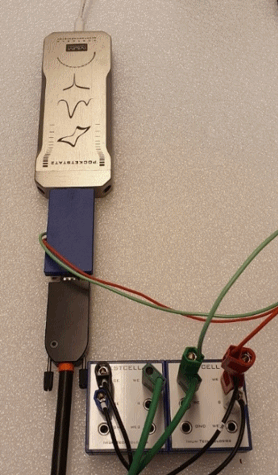
Note that the Cell-PDA is up-side down in the picture because of the orientation of cell connector of the pocketSTAT2.
The CE+RE of the cell cable are connected to the TestCell1 to the left, the WE+S of the cell cable are connected to the Testcell1 to the right.
The Cell-PDA is connected across the Testcell1 to the right.
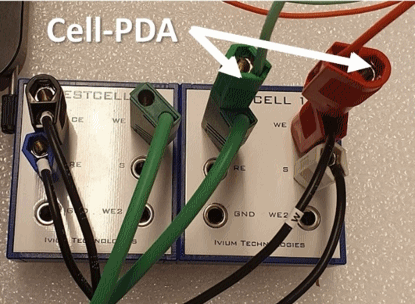
This connection should result in 2 impedance signals of 2kOhm and 1kOhm respectively.
IviumSoft
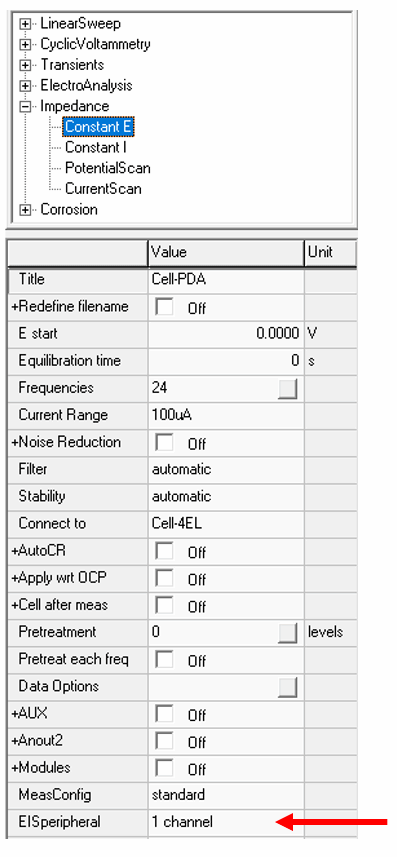
The measurement is done using the technique Impedance Constant E (50kHz to 1Hz, 50mV amplitude, 5 freq/decade):
To activate the EIS measurement on the Cell-PDA (analog input) select the method parameter “EISperipheral” and choose “1 channel”.
Ensure the option Stackanalyser/PDA is active in the options>options window (see page 1).
Measurement
Running the measurement will result in 2 EIS signals in the same graph. Each signal will be stored separately in its own scan in the Legend panel. Each scan can be analysed in the Sigview window and can be fitted in the Equivalent circuit evaluator.
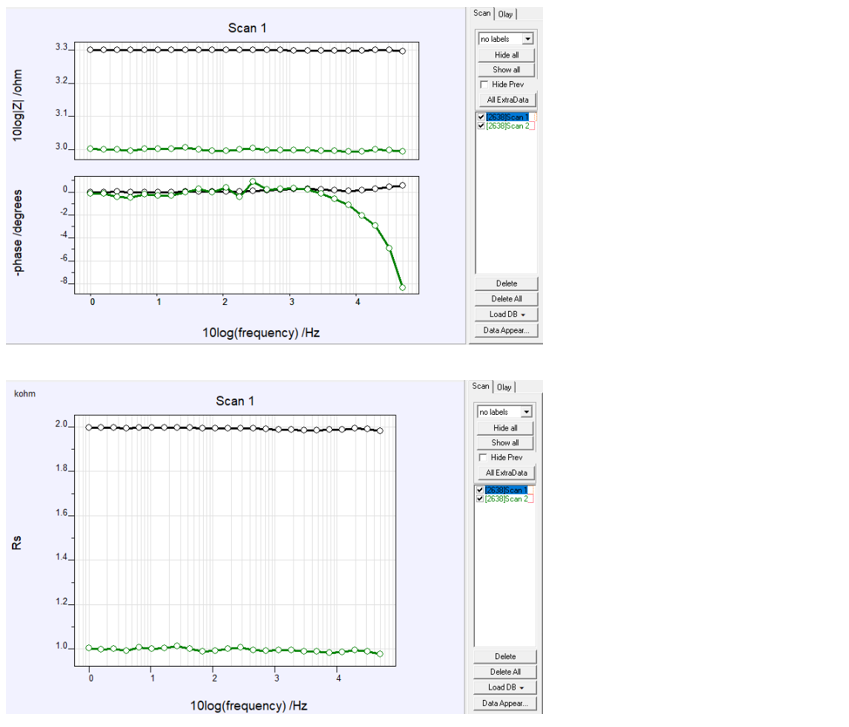
Scan 1 (black) is the primary signal, i.e. the cell cable. Scan 2 (green) is Cell-PDA signal
As can be seen, the measured signals correspond to the connections:
Scan 1: Cell cable – 2 x Testcell1 in series – 2kOhm
Scan 2: Cell-PDA – Testcell1 to the right – 1kOhm
Example 2: measurement on 2 batteries
Setup
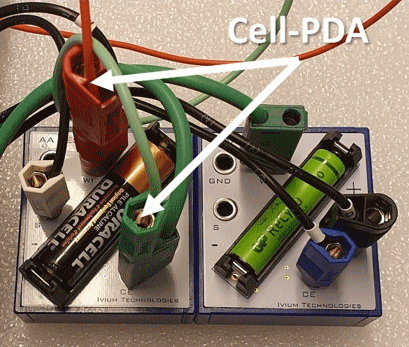
In this example a PocketSTAT2 + Cell-PDA is connected to 2 batteries in series, an AA-battery and an AAA-battery.
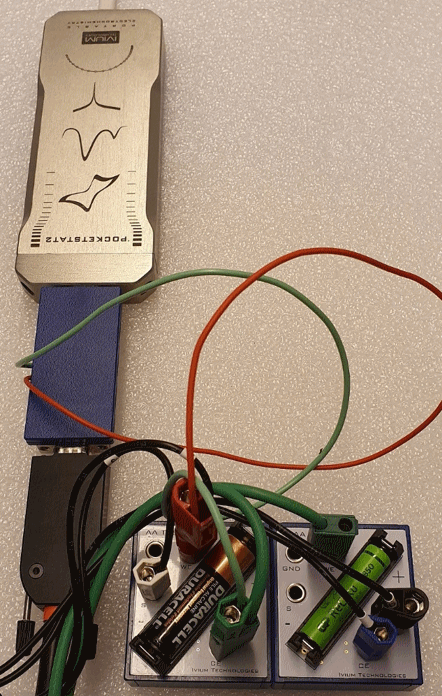
The WE+S are connected to the + of the battery to the left. The CE+RE are connected to the – of the battery to the right. The cell cable will thus measure the impedance of the total (= the two batteries in series).
The Cell-PDA is connected across the battery to the left. Cell-PDA +ve channel to AA battery +ve terminal and Cell-PDA -ve channel to AA battery -ve terminal.
IviumSoft
The measurement is done using the technique Impedance Constant I (10kHz to 1Hz, 20mA amplitude, 5 freq/decade):
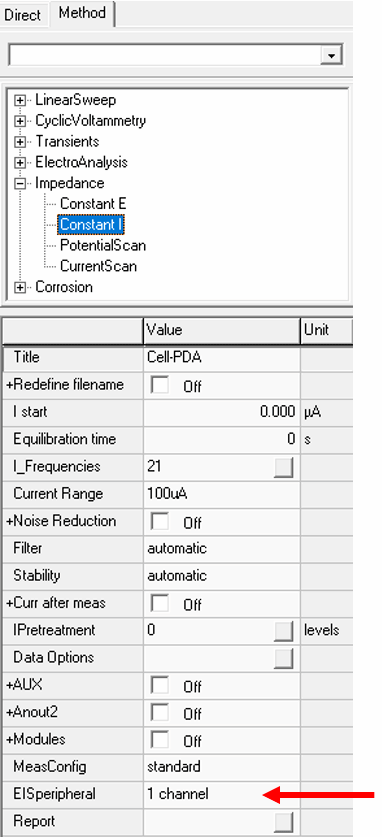
To activate the EIS measurement on the Cell-PDA (analog input1) select the method parameter “EISperipheral” and choose “1 channel”. Now the analog input 1 is measured via the Cell-PDA.
Ensure the option Stackanalyser/PDA is active in the options>options window (see page 1).
Measurement
Running the measurement will result in 2 EIS signals in the same graph. Each signal will be stored separately in its own scan in the Legend panel. Each scan can be analysed in the Sigview window and can be fitted in the Equivalent circuit evaluator.
In the result graphs below the Nyquist plot, Bode plot and Rp results are shown.
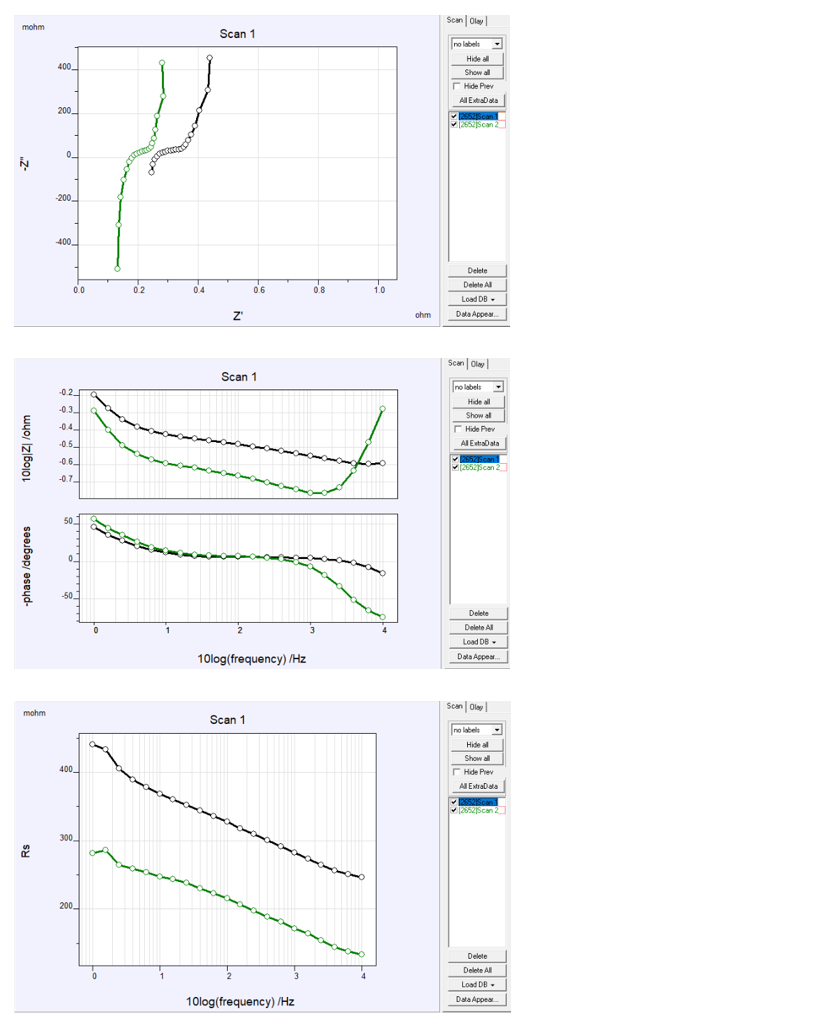
In the measurement results, the different impedances can clearly be distinguished between the total (black line, scan1) and the AA-battery to the left (green line, scan2).
sPDA
Most Ivium potentiostats that are equipped with a peripheral port have a 15pin subD connector to interface with this port. The sPDA is a module that connects to the 15pin peripheral port.
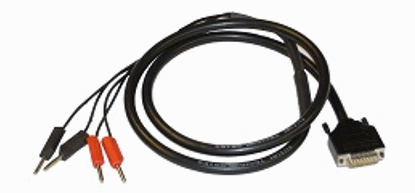
It creates 2 high impedance differential analog input signals (Ch1 and Ch2) that can be connected directly to the cell using 4mm bananas.
Using the sPDA for a multi-point simultaneous EIS measurement will result in up to 3 impedance signals:
– 1 EIS signal from the cell cable
– up to 2 EIS signals from the sPDA
Example 3: resistor measurement
Setup
In this example a Vertex.1A.EIS potentiostat + sPDA is connected to 3 x Testcell1 in series (each 1kOhm).
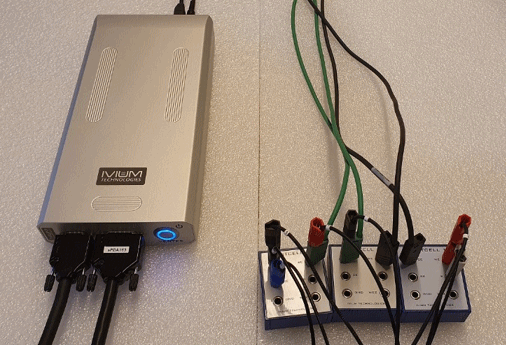
The CE+RE of the cell cable are connected to the TestCell1 to the left, the WE+S of the cell cable are connected to the Testcell1 to the right.
On the sPDA, Ch1 is connected across Testcell1 to the left, Ch2 is connected across the 2 x Testcell1 to the right.
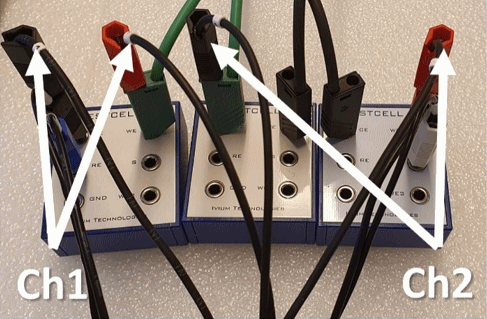
This connection should result in 3 impedance signals of 3kOhm, 1kOhm and 2kOhm respectively.
IviumSoft
The measurement is done using the technique Impedance Constant I (10kHz to 10Hz, 1mA amplitude, 5 freq/decade):
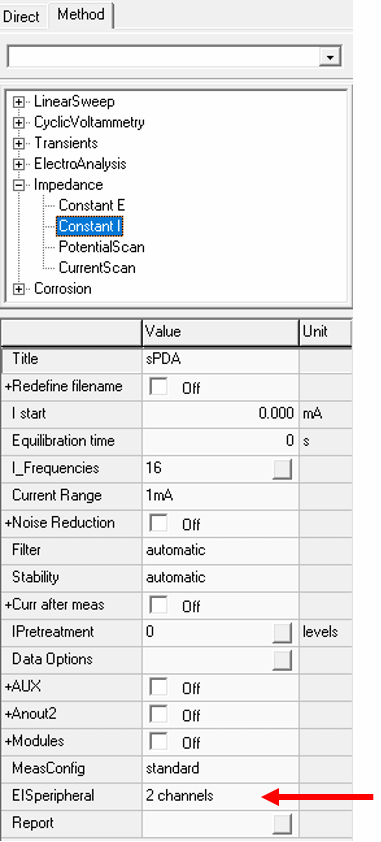
To activate the EIS measurement on the sPDA (analog inputs) select the method parameter “EISperipheral” and choose “1 channel” or “2 channels”. Now both Ch1, or both Ch1 and Ch2 of the sPDA will be used.
Ensure the option Stackanalyser/PDA is active in the options>options window (see page 1).
Measurement
Running the measurement with 2 channels will result in 3 EIS signals in the same graph. Each signal will be stored separately in its own scan in the Legend panel. Each scan can be analysed in the Sigview window and can be fitted in the Equivalent circuit evaluator.
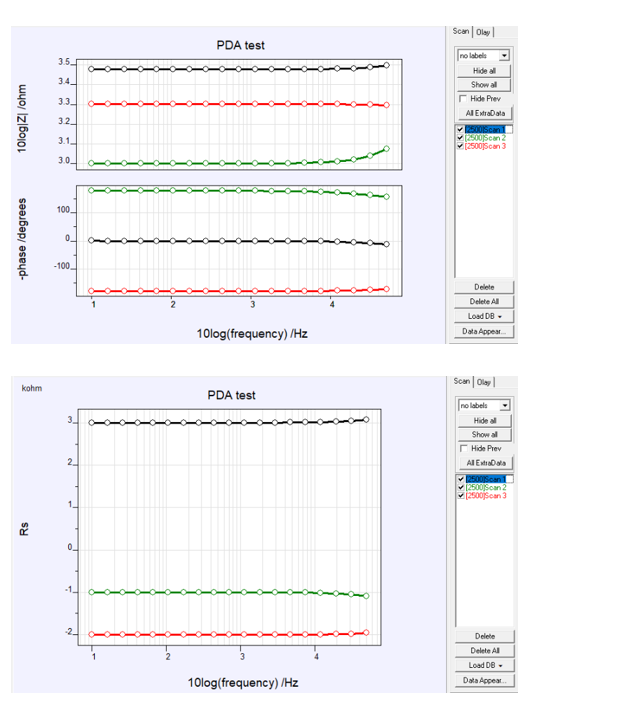
Scan 1 (black) is the primary signal, i.e. cell cable.
Scan 2 (green) is Ch1 of the sPDA
Scan 3 (red) is Ch2 of the sPDA.
As can be seen, the measured signals correspond to the connections:
Scan 1: 3xTestcell1 – 3kOhm
Scan 2: Testcell1 to the left – 1kOhm
Scan 3: 2xTestcell1 to the right – 2kOhm
Example 4: measurement on 2 batteries
Setup
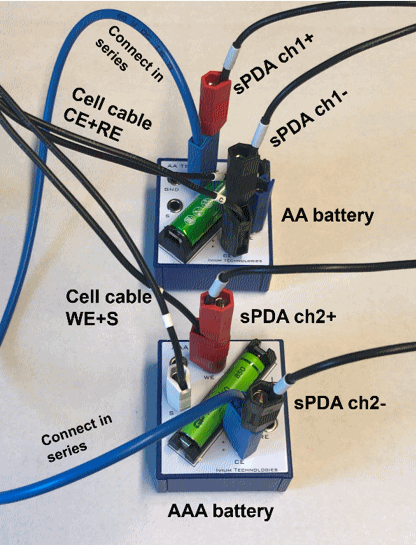
In this example a Vertex.1A.EIS + sPDA is connected to 2 batteries in series, an AA battery and an AAA battery.
The CE+RE are connected to the – of the AA battery (top). The WE+S are connected to the + of the AAA battery (bottom). The cell cable will thus measure the impedance of the total (= the two batteries in series).
The sPDA is connected with Ch1+ to the + of the AA battery (top) and Ch1- to the – of the AA battery (top).
The sPDA is connected with Ch2+ to the + of the AAA battery (bottom) and Ch2- to the – of the AAA battery (bottom).
IviumSoft
The measurement is done using the technique Impedance Constant I (10kHz to 10Hz, 50mA amplitude, 5 freq/decade):
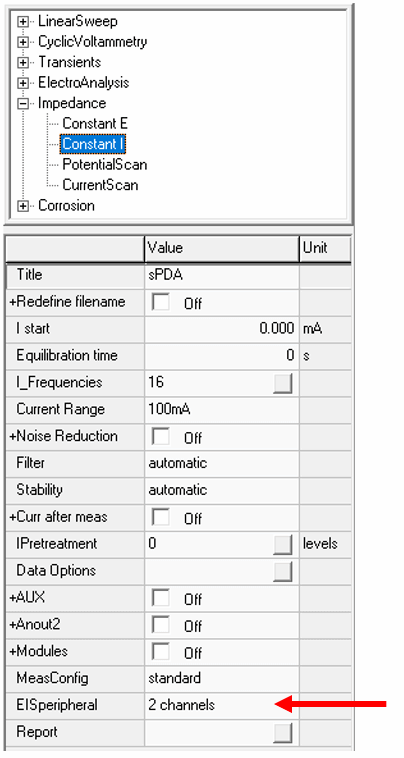
To activate the EIS measurement on the sPDA (analog inputs) select the method parameter “EISperipheral” and choose “2 channels”. Now both Ch1 and Ch2 of the sPDA will be used.
Ensure the option Stackanalyser/PDA is active in the options>options window (see page 1).
Measurement
Running the measurement will result in 3 EIS signals in the same graph. Each signal will be stored separately in its own scan in the Legend panel. Each scan can be analysed in the Sigview window and can be fitted in the Equivalent circuit evaluator.
In the result graphs below the Nyquist plot, Bode plot and Rp results are shown.
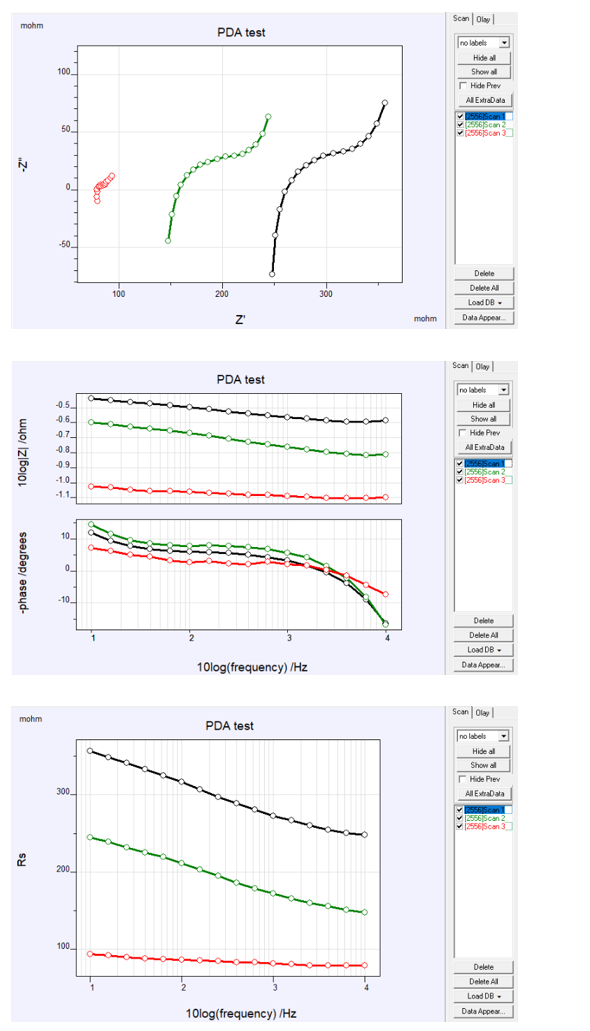
In the measurement results, the different impedances can clearly be distinguished of the total (black line, scan1), battery1 (green line, scan2) and battery2 (red line, scan 3).
StackAnalyser
The StackAnalyser is a module that can be connected to the 15pin peripheral port of an Ivium potentiostat.
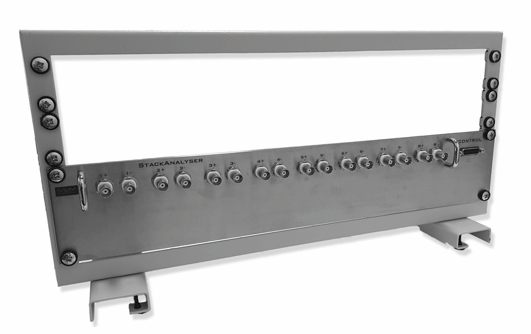
The module is powered from a 5V DC power supply and connects to the 15pin subD connector of the peripheral port. At the front the StackAnalyser has 8 channels, each with 2 BNC connectors for the Ch- and Ch+ respectively. In this case, each of the 16 BNCs has its own BNC to 4mm banana cable.
The Ch- and Ch+ connections of each of the 8 channels can be connected to any point of the cell or cell-stack.
When the StackAnalyser is connected, the user can make a choice to measure 1, 2, 4 or all 8 channels. Together with the primary cell cable, this results in a maximum of 9 EIS signals.
Example 5: resistor measurement
Setup
In this example a Vertex.1A.EIS potentiostat + StackAnalyser is connected to 10 x 1Ohm resistors in series.
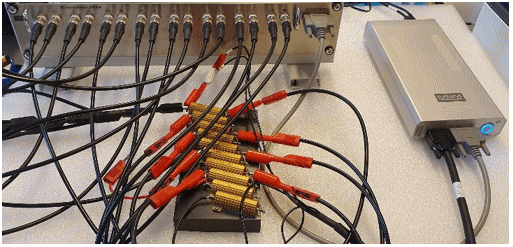
The WE+S of the cell cable are connected to the resistor to the left, the CE+RE of the cell cable are connected to the resistor to the right.
On the StackAnalyser, The Ch- of each of the 8 channels are connected to the resistor to the left; the Ch+ of each channel is connected across each following resistor (i.e. Ch1+ across the resistor to the left, Ch2+ across the next resistor from the left, Ch3+ to the third resistor in line, etc.).
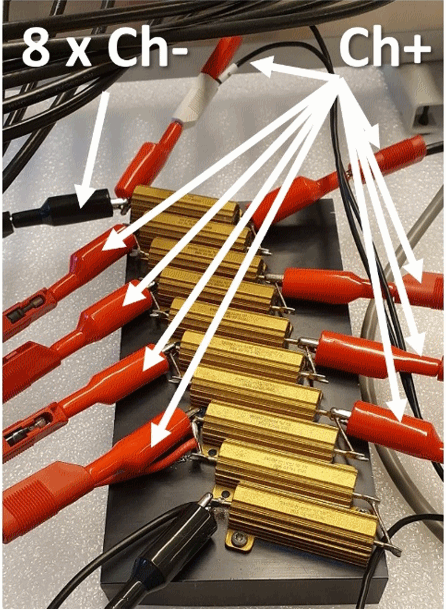
This connection should result in 9 impedance signals of 10 Ohm and 1 Ohm – 8 Ohm respectively.
IviumSoft
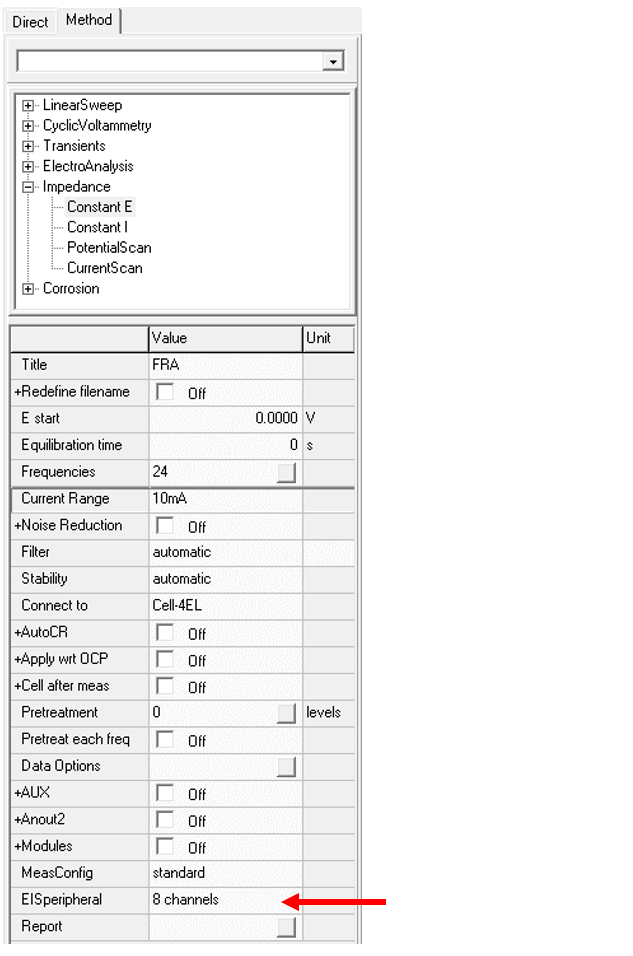
Subsequently, the measurement is done using the technique Impedance Constant E (50kHz to 1Hz, 50mV amplitude, 5 freq/decade):
At the method parameter “EISperipheral” the number of channels needs to be selected (8 channels in this example). Now all 8 channels of the StackAnalyser will be measured.
Ensure the option Stackanalyser/PDA is active in the options>options window (see page 1).
Measurement
Running the measurement with 8 channels will result in 9 EIS signals in the same graph. Each signal will be stored separately in its own scan in the Legend panel. Each scan can be analysed in the Sigview window and can be fitted in the Equivalent circuit evaluator.
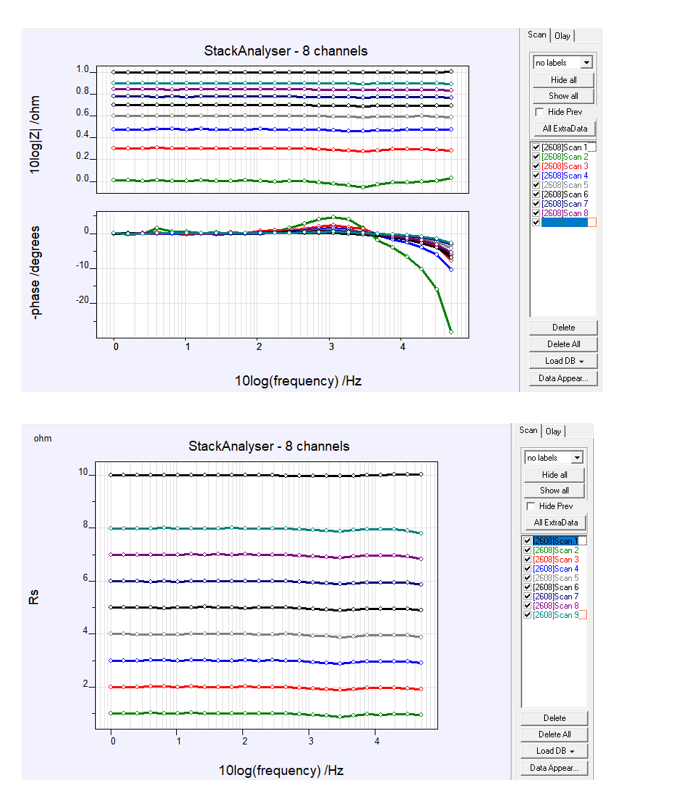
Scan 1 is the primary signal, i.e. the cell cable.
Scan 2 is Ch1 of the StackAnalyser
Scan 3 is Ch2 of the StackAnalyser
etc.
As can be seen, the measured signals correspond to the connections:
Scan 1: cell cable – 10 Ohm
Scan 2: resistor to the left – 1 Ohm
Scan 3: 2nd resistor from the left – 2 Ohm
etc.