A printable version of this application note is available here: A4.1 – Electrochemical impedance spectroscopy – Theory
Electrochemical Impedance Spectroscopy (EIS) is a technique that can be used to separate and quantify the impedances of (electro)chemical processes and reactions. As these processes and reactions occur at different time scales, it is possible to trigger them individually by varying the frequency of a sinusoidal voltage or current perturbation.
The choice to apply a sinusoidal voltage and current depends on the expected response of the electrochemical system. The most commonly used EIS method is to apply an AC voltage as it typically leads to small oxidation and reduction currents. For measurements on low impedance samples, such as batteries, supercapacitors and fuel cells, a small voltage perturbation can cause high currents. Not only can high currents easily become larger than the current compliance of the potentiostat, they may also push the electrochemical system far out of (semi‑) equilibrium. Therefore, applying an AC current perturbation is more common for those studies.
The frequency of the voltage or current perturbation can span over a wide range of frequencies, typically from mHz to MHz. The direction of the frequency scan is typically from high to low frequencies as it leads to fewer issues of current overloads.
In the case of a voltage perturbation the applied voltage (E) is defined as
E = EDC + EAC = EDC + EMsin(ωt)
where EDC is the constant voltage and EAC is the voltage between the working electrode (WE) and reference electrode (RE), respectively. EM is the amplitude of the sinusoidal voltage perturbation, ω is the angular frequency and t is the time. ω can be further defined as
ω = 2πf
where f is the frequency of the voltage perturbation. EM is typically small (e.g. <10 mV) to ensure the electrochemical system response is pseudo-linear. Consequently, when applied to an electrochemical system the current response is similar to the sinusoidal voltage perturbation, although it can be shifted by a phase angle (θ) relative to the voltage perturbation.
For a pure resistor the phase angle is 0° resulting in a current response that is in phase with the sinusoidal voltage perturbation. For a pure capacitor the current response is -90° out of phase. The current response of a pure resistor and a pure capacitor are shown in Figure 1.
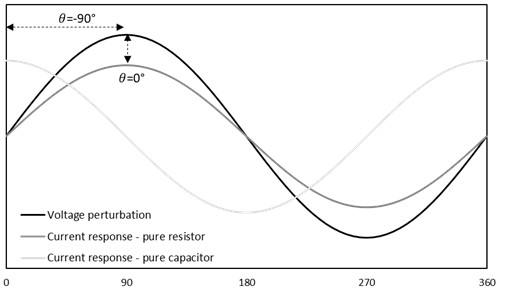
Figure 1: Current response of a pure resistor and pure capacitor to an AC voltage perturbation.
The ratio between the voltage E and the current I is the known as the impedance Z, which is a complex function that consists of real part Z’ and an imaginary part Z”. In Cartesian coordinates the impedance is written as
Z = Z’ – iZ”
with i = √-1. By plotting –Z” as a function of Z’ a Nyquist plot is obtained, which gives visual insights into the studied system such as the electrolyte resistance. A way to preserve the frequency dependence of the impedance is to plot |Z| as a function of the perturbation frequency, which is also known as a Bode plot.