A printable version of this application note is available here: A1 – IviumStat and TDI-load operation
Impedance measurements on a 3-cell sealed lead acid battery using an IviumStat and an electronic load
A potentiostat/galvanostat is used to control and measure electrochemical cells. The potentiostat/galvanostat is capable of “linear control” of the electrochemical cell from negative to positive potentials and currents (and vice versa), i.e. charging and discharging of a battery. However, most potentiostat/galvanostats are limited in the power/current output. In some of these cases it is possible to use a programmable electronic load to test high power electrochemical systems. An electronic load in general has much higher current capacity.
In principle a load is similar, but not as versatile, compared to a potentiostat/ galvanostat: loads can only “consume” power and not deliver it, and loads generally do not have a frequency response analyser available. Moreover, loads, by operating principle, cannot go “through zero”. In the battery example: loads cannot charge a battery, nor can loads short circuit a battery down to 0V potential.
But in various cases a load is useful for testing purposes when high currents are required, i.e. for battery and fuel cell testing.
To accommodate testing with an electronic load and an available potentiostat, Ivium potentiostats can be operated to control the load, and do frequency response measurements on an electrochemical cell with/via the load.
An Ivium potentiostat/galvanostat, like the IviumStat can control peripheral equipment in two ways, i.e. by using the peripheral outputs or using the cell output. Because all Ivium potentiostats/galvanostats have a built-in frequency response analyser, also impedance measurements can be done in combination with a load. Our standard IviumStat rates ±5A@±10V, with various potential and current ranges.
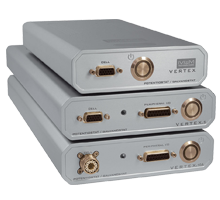
A load can vary in shapes, sizes and capacities. Depending on the make and model they come with different input/output interfaces. For this experiment a TDI-Dynaload was used, model RBL488-800, with a maximum voltage of 100 V (ranges 10-50-100V full scale) and a maximum current of 120 A (2-20-120A full scale). It was equiped with an IEEE-488 interface (RS-232 optional but not installed on this device) and an analog interface (terminal block).
In principle, higher capacity loads and different make&model loads are operated in a similar manner.
As test subject a sealed lead acid (LA) battery was used (HYS613). The LA battery consisted of 3 cells with a nominal voltage of 6 V and a nominal capacity of 1.3 Ah.
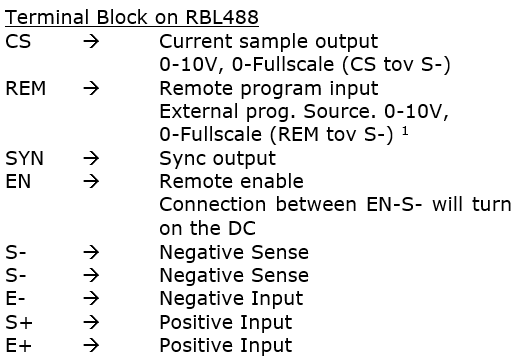
The TDI RBL488 is equipped with a 9-points terminal block [1]:
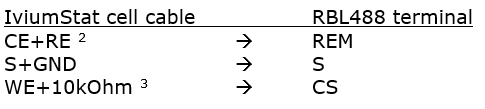
The connections between the IviumStat and the Dynaload were made as shown below [2], [3]:
The positive and negative leads of the Dynaload were connected respectively to the positive and negative terminals of the sealed LA battery.
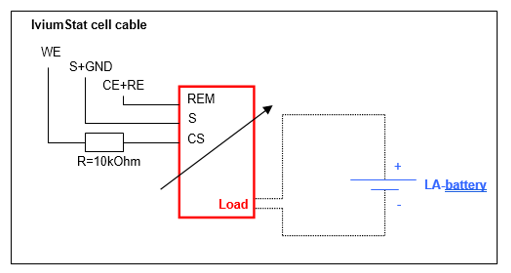
Figure 1: Schematic of the connections IviumStat-Dynaload
With the equipment set-up as described measurements were carried out on the LA battery. Because a load can only consume power the battery needed to be operated in the discharge region, so a bias voltage was be applied.
First an LSV was recorded with the IviumStat controlling the Dynaload, then the IviumStat was connected directly to the LA battery (via the standard cell cable). The experiments were carried out in CV mode. Because of the control of the Dynaload the values chosen in the IviumSoft need to be different;
for the Dynaload operation:
– E-Start = -3.95 V, E-end = -4.5 V, will result in a 6.05 V to 5.5 V scan
– E step = 5 mV, Scanrate = 0.025 V/s
– IviumStat current range CR=1mA
– 4-Electrode cell connection (default)
for the IviumStat operation:
– E-Start = 6.05 V, E-end = 5.5 V,
– E step = 5 mV, Scanrate = 0.025 V/s
– IviumStat current range CR=1A, will be measured directly
– 4-Electrode cell connection (default)
An impedance experiment was carried out with the IviumStat controlling the Dynaload, then the IviumStat was connected directly to the LA battery and the experiment was repeated. The method parameters for each measurement are given in Annex 1. As can be seen from these parameters for the Dynaload operation the values need to be chosen differently;
for the Dynaload operation:
– DC-bias: -4 V, to get +4V at the CE+RE and 10-4=6V will be applied to the cell
– IviumStat current range CR=1mA
– 4-Electrode cell connection (default)
for the IviumStat operation:
– DC-bias: 6V, will be applied to the cell directly
– IviumStat current range CR=1A, will be measured directly
– 4-Electrode cell connection (default)
In both measurements the frequency was scanned in single sine mode from 5000Hz down to 3Hz with 10 frequencies per decade and an amplitude of 20mV (parameters: see Annex 1). The Dynaload was operated in CV mode.
The results for the LSV scan are given in Figure 2 [4].
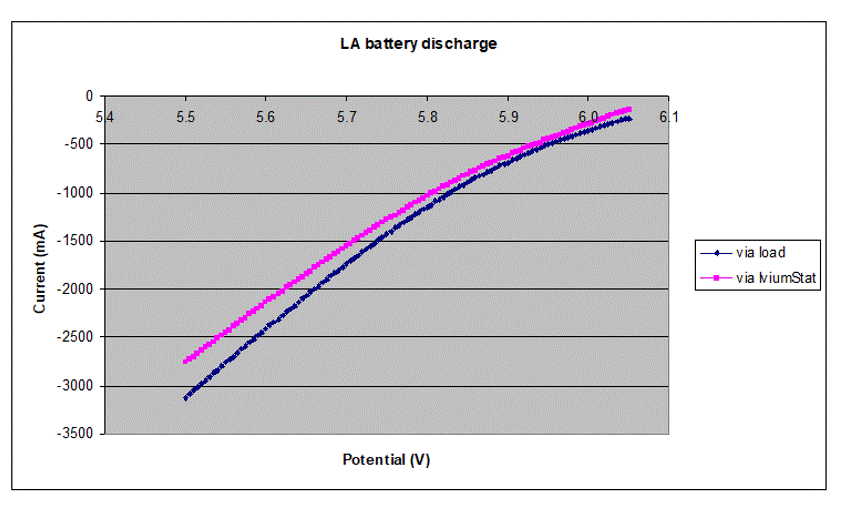
Figure 2: LSV results
As can be seen in these results, both measurement directly with an IviumStat and measurement using an IviumStat to control the Dynaload yield stable results. Note that the difference in current between the experiments is caused by the difference in state of charge of the LA battery.
The results for the impedance measurements are given in the graphs below [5].
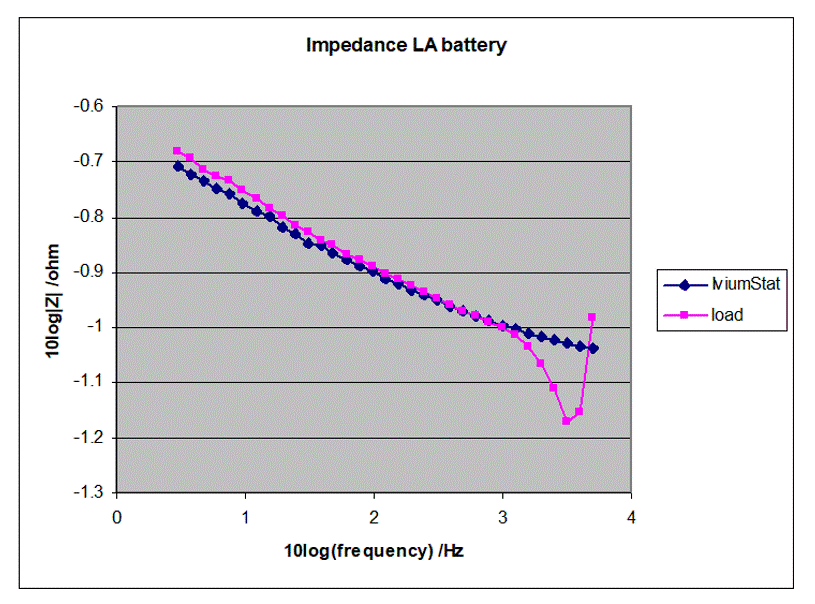
Figure 3: Impedance results
As shown in the graph above, both the measurement via the load and the measurement directly with the IviumStat show the same results up to ca. 1 kHz frequency. It should be noted that the battery was operated at a DC bias in the discharge region, leading to a bias discharge current. This explains the variance in the impedance as a function of frequency (and time).
At higher frequencies, the load shows odd behaviour, the IviumStat continues to perform well. This can be explained by looking at the phase angle during the measurement (see Figure 4).
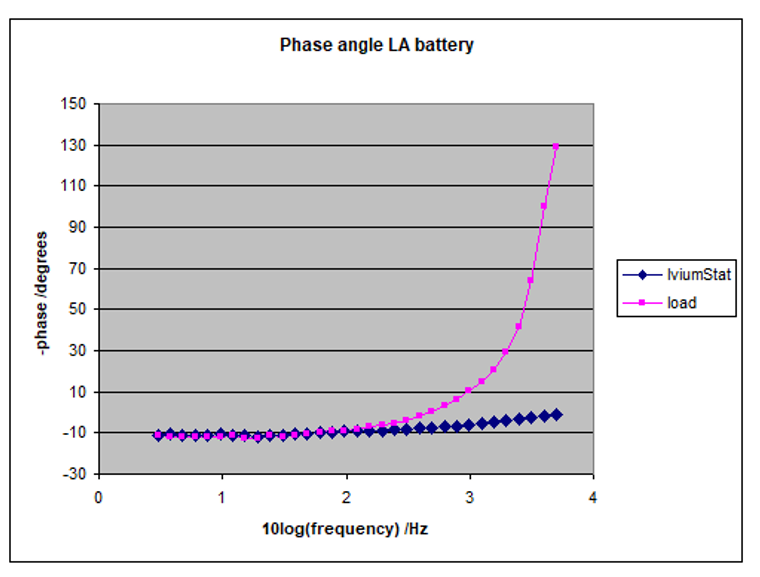
Figure 4: Phase angle results
In figure 4 it shows that the phase angle in the frequency region 3 Hz to 1E+3 Hz is about equal for both devices. However, when using the load it shows that towards higher frequencies the absolute phase angle increases. This is expected, given that the bandwidth of the load is lower (ca. 1.6 kHz; determined from the slew rate setting of 100µs) than that of the IviumStat (1 MHz).
These results show that in this particular case, the load should not be operated at frequencies over ~1 kHz [6].
Annex 1: Method parameters impedance measurement
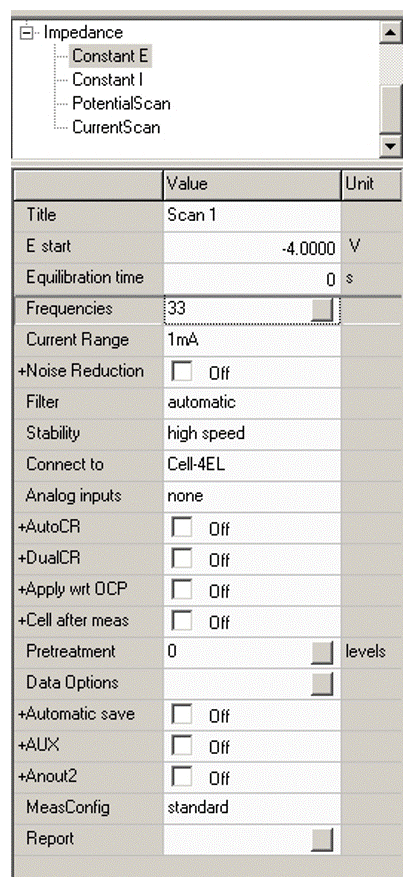
Method parameters for measurement via load
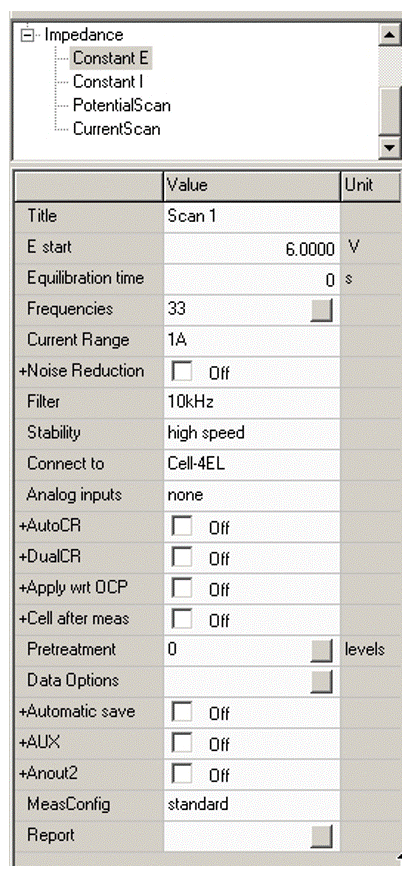
Method parameters for measurement via IviumStat
Method frequencies:
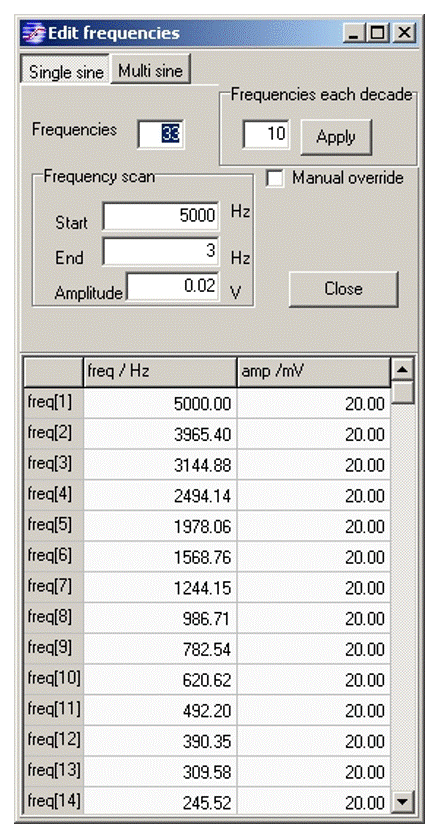
[1] The externally applied signal is deducted from 10V, the result is applied to the cell.
The optimal way to use the capability of the IviumStat and IviumSoft software is using the cell cable directly to control the load.
[2] Because the CE+RE is negative w.r.t. the set potential at the WE, a negative potential needs to be set in order to get a positive potential at the REM.
[3] A 10 kOhm resistor was connected between WE and CS to accommodate the maximum output current of the CS terminal. With a 10 V maximum output of CS and the 10 kOhm resistor in place the maximum current measured on WE is 1 mA, which is taken as the current range for the impedance measurement.
[4] When comparing the LSV results, a multiplying factor needs to be taken into account: given that the load was operated at 20A full scale, and full scale equals an output of 10V, which will result in a measurement of 1 mA at the WE at full scale, this factor equals 2E+4.
[5] When comparing the impedance results, a multiplying factor needs to be taken into account: given that the load was operated at 120A full scale, and full scale equals an output of 10V, which will result in a measurement of 1 mA at the WE at full scale, this factor equals 1.2E+5.