A printable version of this electrochemical note is available here: IEN8 – Contour diagrams
Contour diagrams can be used to estimate the accuracy of impedance measurements. This note explains how to apply these. The contour area is enclosed by segments, that have a relation to the specific properties of the instrumentation.
A contour diagram defines within which boundaries of frequency and impedance, one can get an accurate measurement, for example an enclosed area of 1% error or better, see Figure 1. The position/accuracy is defined by the combination of Z and Frequency.
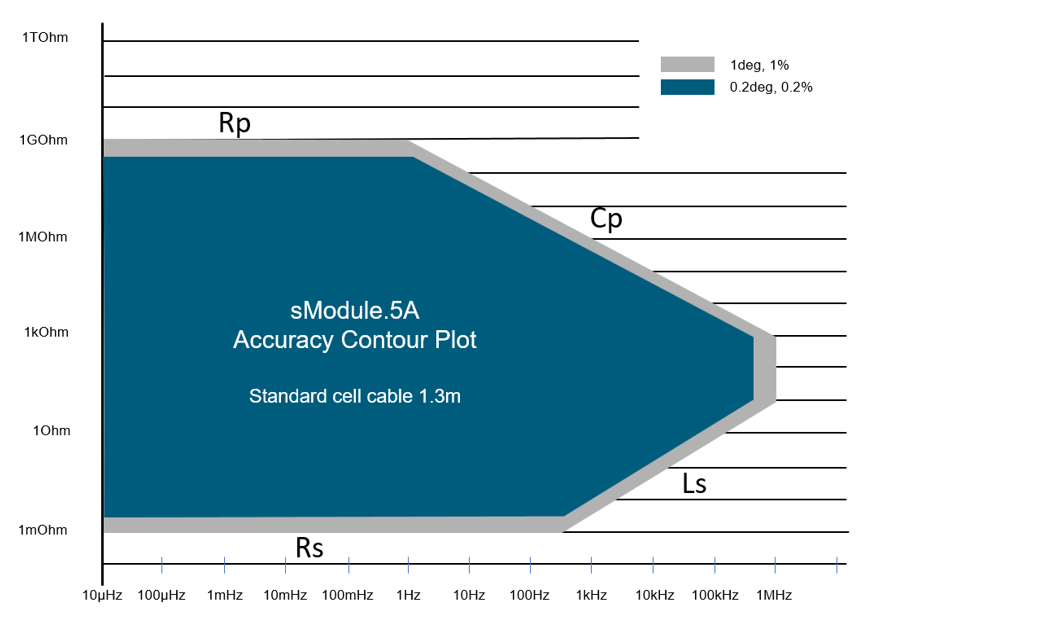
Figure 1: Accuracy contour plot of sModule5A
In a cascaded signal path, errors are dominated by the “worst performing part”. In combinations of a FRA with a potentiostat, generally the front-end properties are the bottleneck: the potentiostat is the main error source and determines the contour plot. A good FRA should not contribute to inaccuracy much, and its impact of FRA errors is usually not visible in the contour plot. We therefore should focus on the potentiostat.
In the Contour plot, several segments can be distinguished:
The accuracy can be improved (the contour-area widened) when calibration is applied. However, in reality this only helps a little. Often the parasitic effects are not stable, as they vary with temperature, air humidity, and cable configuration. For example, the mutual inductance value will change if you move the cell cable to another position.
The contour diagram is directly linked to the design of the electronic hardware: potentiostat and cabling. When these are made to perform in a wide range of frequencies and impedances, as for sModule5A, these are not always optimal for extreme cases. For instance, if the primary interest is for high impedances, better performance is achieved with a dedicated low current instrument, see below Figure 2 the pocketSTAT.LC contour plot. Here the Rp is much higher, and the Cp smaller, so it will be able to measure much higher impedances, and lower capacitor values. However, its 3-electrode config will not be able to measure low impedances as well as an sModule5A.
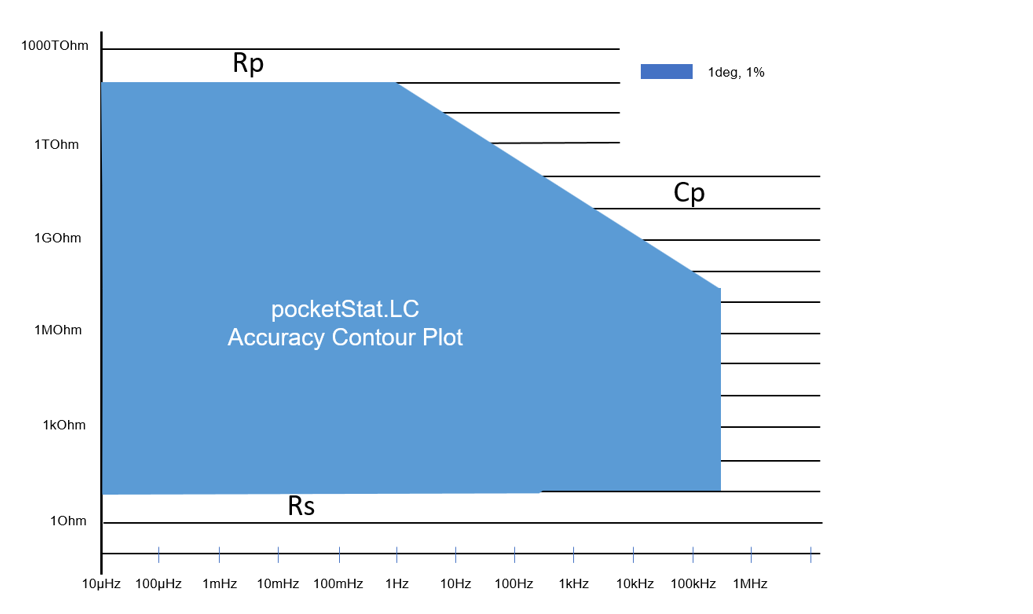
Figure 2: Accuracy Contour plot pocketSTAT.LC